-
Bahasa Indonesia
-
English
Postingan saya terdahulu yang berisi uji-uji statistika dalam format satu halaman telah memperoleh respons positif dan sangat memudahkan para mahasiswa dan/atau dosen untuk belajar Pengantar Metode Statistika di perguruan tinggi baik pada level S1, S2, maupun S3.
Melalui inbox saya juga memperoleh saran agar memposting BUKAN saja uji-uji statistika dalam Pengantar Metode Statistika TETAPI juga uji-uji statistika lanjutan. Perlu diketahui bahwa uji-uji dalam Pengantar Metode Statistika yang dibahas dalam kuliah-kuliah S1, S2 maupun S3 itu memang ditujukan untuk mereka yang BUKAN berlatar belakang pendidikan STATISTIKA dan pada umumnya dikenal sebagai Univariate Statistical Analysis, yang artinya analisis-analisis itu HANYA digunakan untuk mengkaji variabel RESPON secara tunggal. Jika kita memiliki variabel RESPON ganda (artinya variabel RESPON lebih dari satu), maka penggunaan Univariate Statistical Analysis dalam Pengantar Metode Statistika TIDAK MAMPU melakukan analisis RESPON ganda secara sekaligus.
Bagi mereka yang berlatar belakang STATISTIKA atau berkesempatan menggunakan uji-uji terhadap variabel RESPON yang banyak (lebih dari satu variabel RESPON) maka akan familiar dengan Multivariate Statistical Analysis. Beberapa topik yang sering dipelajari dan digunakan dalam Multivariate Statistical Methods adalah:
Cluster Analysis, Discriminant Analysis, Principal Component Analysis, Factor Analysis, Correspondence Analysis, Multi Dimensional Scaling, Multivariate Analysis of Variance (MANOVA), Multivariate Analysis of Covariance (MANCOVA), Principal Component Regression Analysis, Multivariate Regression Analysis, dll.
CATATAN: perbedaan antara Multivariate Regression Analysis dengan Multiple Regression Analysis adalah jika Multiple Regression Analysis HANYA mampu melibatkan satu variabel RESPON (Dependent Variable) yang termasuk ke dalam Univariate Statistical Method, maka Multivariate Regression Analysis mampu mengkaji analisis terhadap banyak variabel RESPON (Dependent Variables) sekaligus dan ini termasuk dalam Multivariate Statistical Method.
Landasan utama untuk belajar Multivariate Statistical Analysis adalah analisis Matriks dan tentu saja pemahaman terhadap Univariate Statistical Analysis secara mendalam!
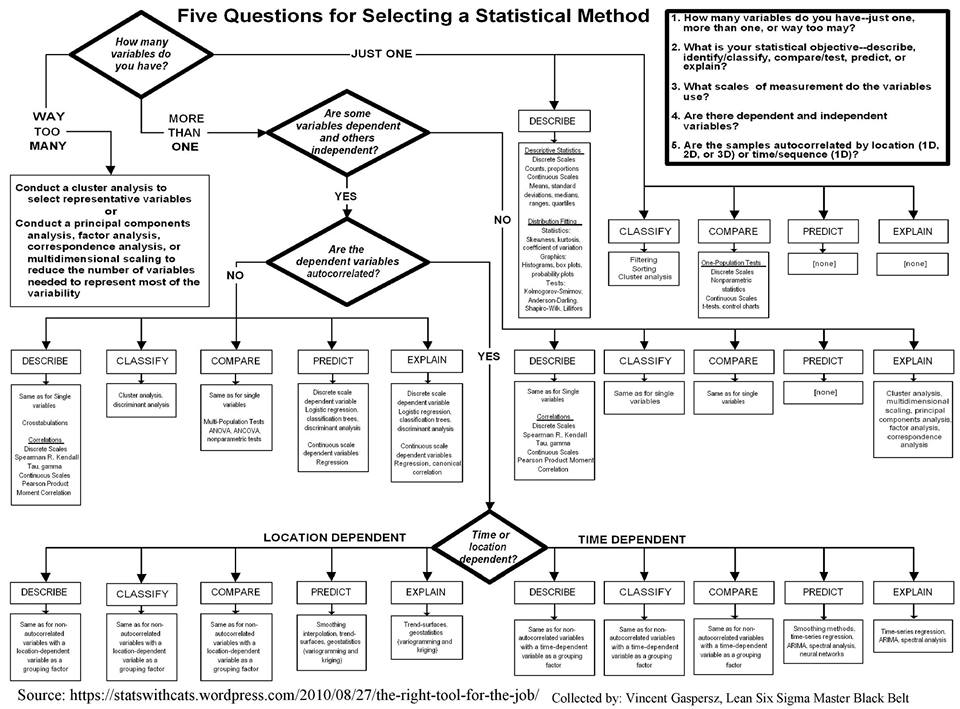
Lampiran satu halaman di atas memuat bagaimana memilih metode statistika yang benar, baik pada Univariate Statistical Analysis maupun Multivariate Statistical Analysis.
Pernyataan berikut: In God We Trust, All Others Must Bring Data, menunjukkan bahwa HANYA kepada Tuhan kita percaya 100% dan TIDAK PERLU bertanya-tanya, TETAPI untuk hal-hal yang lain kita HARUS menganalisis data dengan metode-metode statistika atau kuantitatif yang benar, efektif, dan efisien!
Rahasia penggunaan semua uji-uji statistika khususnya berkaitan dengan korelasi dan regresi tergantung pada skala pengukuran (nominal, ordinal, interval, rasio), karena skala pengukuran menentukan pola distribusi data apakah normal atau tidak normal.
Tabel berikut menunjukkan uji-uji statistika yang cocok pada berbagai skala pengukuran baik pada variabel terikat/tak-bebas (dependent or outcome variable) dengan variabel bebas (independent or input variable). Semua test yang sesuai ada dalam tabel terlampir.
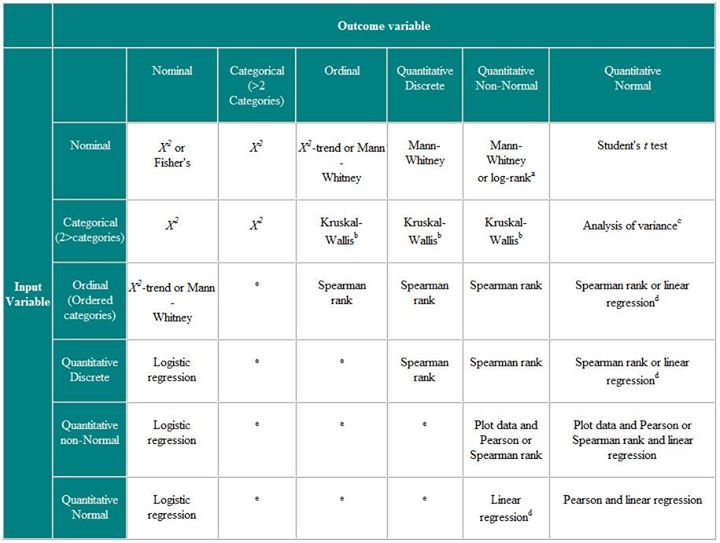
Catatan: skala interval termasuk data kuantitatif diskrit, sedangkan skala rasio termasuk data kuantitatif kontinu (bisa berdistribusi normal atau tidak berdistribusi normal/non-normal)
Dalam kasus penjualan yang diukur dengan skala rasio (ratio) untuk dependent or outcome variable sedangkan variabel bebas (independent or input variable) merupakan data kualitatif yang dikuantitatifkan sebagai skala ordinal, maka dalam Tabel kita HARUS menggunakan korelasi rank spearman (bukan korelasi pearson seperti yang selama ini digunakan) untuk menganalisis hubungan antara kedua variabel, dan dapat menggunakan regresi linear apabila data berdistribusi normal. Contoh skala ordinal adalah tingkat kepuasan dengan skor 1 – 5, di mana: 5 = sangat puas, 4 = puas, 3 = netral, 2 = tidak puas, dan 1 = sangat tidak puas.
Silakan baca informasi tentang Descriptive Research di sini:
http://www.okstate.edu/ag/agedcm4h/academic/aged5980a/5980/newpage110.htm
Penyajian dalam bentuk lain tentang uji-uji statistika univariate (univariate statistical tests) berdasarkan skala pengukuran (nominal, ordinal, interval, ratio) yang berdistribusi normal dan non-normal akan tampak seperti terlampir.
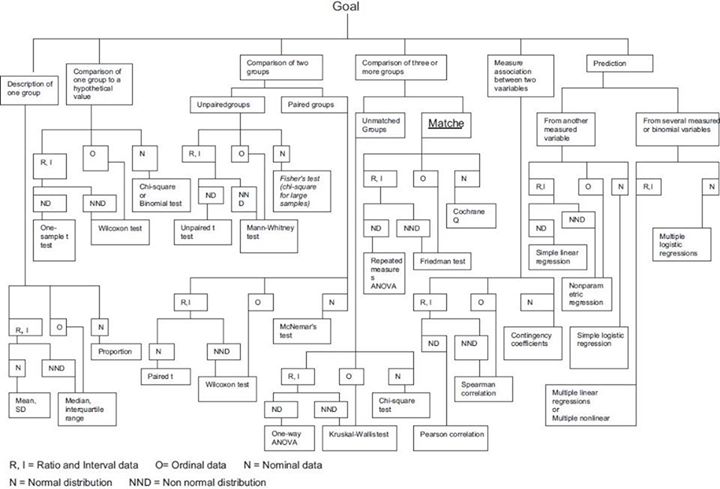
Data dalam skala rasio adalah jenis data kuantitatif yg pengukurannya lebih akurat daripada skala ordinal sehingga tidak perlu mengubah data. Hanya perlu pengujian asumsi tentang distribusi apakah normal atau tidak/non-normal.
Sekarang dengan adanya software statistik macam-macam, lalu orang hanya belajar menerapkan software itu dan bangga seolah-olah telah paham statistika; padahal asal main sikat saja tidak tahu apa asumsi dan persyaratan setiap uji telah dilanggar. Hal ini berlaku bukan pada level S1 saja, tetapi sampai S2 dan S3. Makanya saya sering merasa geli ketika orang menampilkan analisis multiple regression dengan variabel bebas (independent) yang banyak tetapi koefisien determinasi R-kuadrat yg rendah. Langsung saya tahu bahwa pasti telah terjadi pelanggaran asumsi dan persyaratan sekaligus menunjukkan orang itu tidak paham ilmu statistika. Tentang descriptive research yg dijelaskan dalam link di atas bisa bervariasi dari yang paling sederhana hanya menggunakan descriptive statistics seperti tabel2, diagram2, mean, median, modus, dll. sampai analisis statistika lanjutan tergantung tujuan dari descriptive research itu.
Ini link berbahasa Indonesia (meskipun bukan dalam bahasa Indonesia yang baku) tentang seluk beluk penelitian deskriptif.
http://addhintheas.blogspot.com/2013/04/metode-penelitian-deskriptif.html
Jika bertentangan dengan teori berarti landasan teori yang LEMAH, dan/atau metode analisis statistika yang TELAH melanggar berbagai asumsi dan persyaratan. Berikut adalah pembelajaran untuk metode penelitian bisnis:
Ini link tentang langkah-langkah dari RESEARCH PROCESS secara sistematik! Gunakan sebagai panduan dasar dalam melakukan riset!
https://www.shoulderdoc.co.uk/documents/research_flowchart.pdf
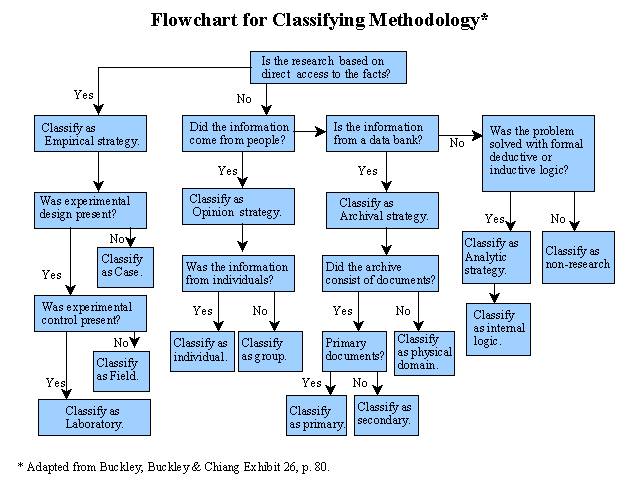
Ini contoh berbagai jenis metodologi penelitian dalam format satu halaman berkaitan dengan bagaimana suatu FAKTA itu diukur atau dikumpulkan.
Artikel berikut CUKUP sederhana pembahasannya berkaitan dengan berbagai KONSEKUENSI pelanggaran terhadap asumsi dan persyaratan dalam metode statistika.
http://www.kompasiana.com/jokoade/konsekuensi-pelanggaran-asumsi-model-statistik_54f6aad1a33311635b8b4597
Jika ingin CEPAT memahami STATISTIKA terutama untuk meningkatkan pemahaman tentang STATISTICAL THINKING, maka buku: Stats With CATS (CATS = Critical Analysis Through Statistics) berikut akan sangat berguna. Pendekatan buku ini adalah membahas secara KOMPREHENSIF melalui diagram satu halaman, kemudian baru menjelaskan secara singkat dan padat tentang point penting dalam diagram satu halaman itu. Dijamin apabila memahami isi buku ini, maka mindset akan STATISTIKA langsung berubah secara signifikan.
http://www.amazon.com/Stats-Cats-Domesticated-Statistics-Analysis/dp/1604944722
Contoh bagi saya pribadi, melalui diagram satu halaman berikut saya langsung paham hampir semua materi pembelajaran tentang bagaimana mempelajari Karakteristik, Pola, Variasi dari FENOMENA dalam POPULASI melalui CATS (Critical Analysis Through Statistics) itu.
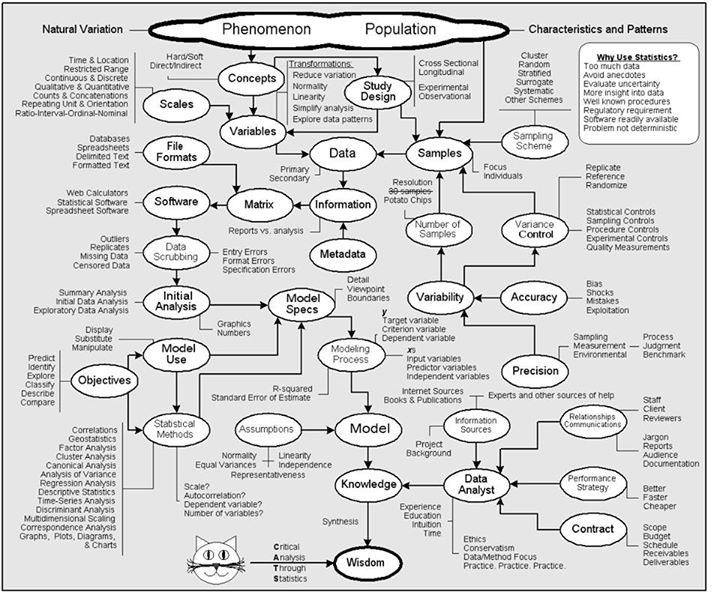
CATATAN: tetapi apabila membaca diagram satu halaman berikut MASIH mengalami kesulitan, maka tunda saja membeli buku Stats With CATS di atas.
Agar diketahui bahwa buku-buku teks yang bagus pada umumnya ditulis dalam bahasa Inggris. Itu makanya Jepang, Korea Selatan, China, dll yang tidak berbahasa Inggris membuat proyek besar-besaran dalam penerjemahan buku-buku bagus ke dalam bahasa Jepang, Korea, China, dll. Bilang saja ke pemerintah Indonesia agar meniru Jepang, Korea Selatan, China, jika penduduknya (kalangan mahasiswa/dosen) HANYA mengandalkan informasi yang tersedia dalam bahasa Indonesia saja.
Salam SUCCESS.
How to Pick Statistical Method? (Continuation)
My last post that contains statistical testings in one-page format has received positive respond and greatly facilitated students and/or lecturers to study Introduction to Statistical Method in university whether at undergraduate, graduate, or postgraduate level.
Through my inbox, I also received suggestion to post NOT only statistical testings that are included in the Introduction to Statistical Methods, BUT also the advanced statistical testings. It needs to be known that testings in Introduction to Statistical Method, that are discussed in the undergraduate to postgraduate courses, are meant for those WITH NO background of STATISTICS education and are generally known as Univariate Statistical Analysis, which means those analyses are ONLY used to singularly examine a RESPONSE variable. If we have multiple RESPONSE variables (more than one RESPONSE variable), then the use of Univariate Statistical Analysis in Introduction to Statistical Method WON’T BE ABLE to do multiple RESPONSES analysis simultaneously.
For those who have STATISTICS background or have the opportunity to use testings toward many RESPONSE variables (more than one RESPONSE variable), then they would be familiar with Multivariate Statistical Analysis. Some topics that are often learned and used in Multivariate Statistical Methods are:
Cluster Analysis, Discriminant Analysis, Principal Component Analysis, Factor Analysis, Correspondence Analysis, Multi Dimensional Scaling, Multivariate Analysis of Variance (MANOVA), Multivariate Analysis of Covariance (MANCOVA), Principal Component Regression Analysis, Multivariate Regression Analysis, etc.
NOTE: The difference between Multivariate Regression Analysis with Multiple Regression Analysis is if Multiple Regression Analysis is ONLY able to involve one RESPONSE variable (Dependent Variable) that is included in Univariate Statistical Method, then Multivariate Regression Analysis is able to review analysis towards many RESPONSE variables(Dependent Variables) simultaneously and this is included inMultivariate Statistical Method.
The main foundation to learn Multivariate Statistical Analysis is Matrix analysis and, of course, the in-depth comprehension towards Univariate Statistical Analysis secara mendalam!
The one-page attachment above contains how to choose the correct statistical method, either on Univariate Statistical Analysis or Multivariate Statistical Analysis.
The following statement: In God We Trust, All Others Must Bring Data, shows that ONLY to God that we believe 100% and UNNECESSARILY ask questions, BUT for other things, we MUST analyze data with statistical methods or quantitative that are correct, effective, and efficient!
The secret of using all statistical testings, especially for those that are related to correlation and regression depend on the measurement scale (nominal, ordinal, interval, rasio), because the measurement scale determines the data distribution pattern whether it is normal or non-normal.
The following table shows the suitable statistical testings on various measurement scales either on bound variables (dependent or outcome variable) or on free variables (independent or input variable). All corresponding tests are in the attached table.

Note: interval scale falls under discrete quantitative, whereas ratio scale falls under continuous quantitative data (can have normal distribution or non-normal distribution)
In a case of sales, it would be measured with ratio scale for its bound variables (dependent or outcome variable), whereas its free variables (independent or input variable) are qualitative data that are quantified as ordinal scale; then in Table, we MUST use rank spearman correlation (notpearson correlation that has been done all this time) to analyze the relationship between both variables, and we can use linear regression if the data have normal distribution. Example of ordinal scale is the satisfaction level with the score of 1 – 5, where: 5 = very satisfied, 4 = satisfied, 3 = neutral, 2 = dissatisfied, dan 1 = very dissatisfied.
Please read the information about Descriptive Research in the link below:
http://www.okstate.edu/ag/agedcm4h/academic/aged5980a/5980/newpage110.htm
Presentation in other forms of univariate statistical tests based on measurement scales (nominal, ordinal, interval, ratio) with normal and non-normal distributions will look something like the attached picture.

Data in ratio scale is a type of quantitative data which has more accurate measurement than in ordinal scale; thus it is not necessary to change the data. It would only need assumption testing about whether it has normal or non-normal distribution.
Now, with the existence of various statistical software, people would only then learn to apply those software and be proud as if they have understood statistics; but actually, they might not even know which testing assumptions and requirements have been violated. This applies not only in the undergraduate level, but also in the graduate and postgraduate levels. That’s why I am often amused when someone displays a multiple regression analysis with many independent variables, but it has low R2 coefficient of determination. Immediately I would know that there has been violations of assumptions and requirements that also show that person do not understand statistics. About descriptive research as explained in the link above, it can vary from the simplest of only using descriptive statistics like tables, diagrams, means, medians, modes, etc., to advanced statistical analysis depending on the purpose of that descriptive research.
This is a link in Indonesian language (although not in a standard Indonesian language) about the ins and outs of descriptive research.
http://addhintheas.blogspot.com/2013/04/metode-penelitian-deskriptif.html
If it contradicts the theory, then it mean that the theoretical basis itself is WEAK, and/or the statistical analysis method HAS violated various assumptions and requirements. The following is a learning for business research method:
This is a link about the systematic steps of RESEARCH PROCESS! Use it as the basic guidelines in doing research!
https://www.shoulderdoc.co.uk/documents/research_flowchart.pdf
This is an example of various research methodologies in one-page format related to how a FACT is measured or collected.

The following article has QUITE simple-to-understand discussion about various CONSEQUENCES of violating assumptions and requirements in statistical method.
http://www.kompasiana.com/jokoade/konsekuensi-pelanggaran-asumsi-model-statistik_54f6aad1a33311635b8b4597
If you want to QUICKLY understand STATISTICS, especially to increase comprehension about STATISTICAL THINKING, then the following book: Stats With CATS (CATS = Critical Analysis Through Statistics) will be very useful. This book’s approach is to COMPREHENSIVELY discuss through one-page diagram, then start explaining briefly and concisely the important points in that one-page diagram. It is guarantee if you understand the content of this book, then your STATISTICAL mindset will be immediately and significantly improved.
http://www.amazon.com/Stats-Cats-Domesticated-Statistics-Analysis/dp/1604944722
Using my personal experience as an example, through the following one-page diagram, I immediately understand almost all learning materials about how study Characteristics, Patterns, Variations of a PHENOMENON in a POPULATION through that CATS (Critical Analysis Through Statistics).

NOTE: if by reading that following one-page diagram, you STILL have difficulties, then just postpone buying that Stats With CATS book above.
Just so you know that good textbooks are generally written in English. That is why Japan, South Korea, China, etc., that don’t speak English, create big projects in translating good textbooks to their respective languages. Just tell the Indonesian government to emulate Japan, South Korea, China, if our people (among students/lecturers) STILL rely only on information that is available in Indonesian language.
Best Regards for SUCCESS.
