-
Bahasa Indonesia
-
English
Oleh: Vincent Gaspersz, Lean Six Sigma Master Black Belt,
The American Society for Quality (www.asq.org) Certified Manager of Quality/Organizational Excellence (CMQ/OE), Certified Quality Engineer (CQE), Certified Six Sigma Black Belt (CSSBB), Certified Quality Auditor (CQA),
The American Production and Inventory Control Society (www.apics.org) Certified Fellow in Production and Inventory Management (CFPIM), Certified Supply Chain Professional (CSCP),
The International Quality Federation (www.iqf.org) Six Sigma Master Black Belt (SSMBB),
The Registrar Accreditation Board (RAB) by Australia-based Quality Society of Australia (QSA)- (www.exemplarglobal.org) Certified Management Systems Practitioneer (CMSP)
Banyak pertanyaan yang muncul dalam inbox facebook saya tentang apa yang dimaksudkan dengan Statistical Tools, Statistical Engineering, dan Statistical Thinking itu serta bagaimana mengaplikasikan mereka masing-masing?
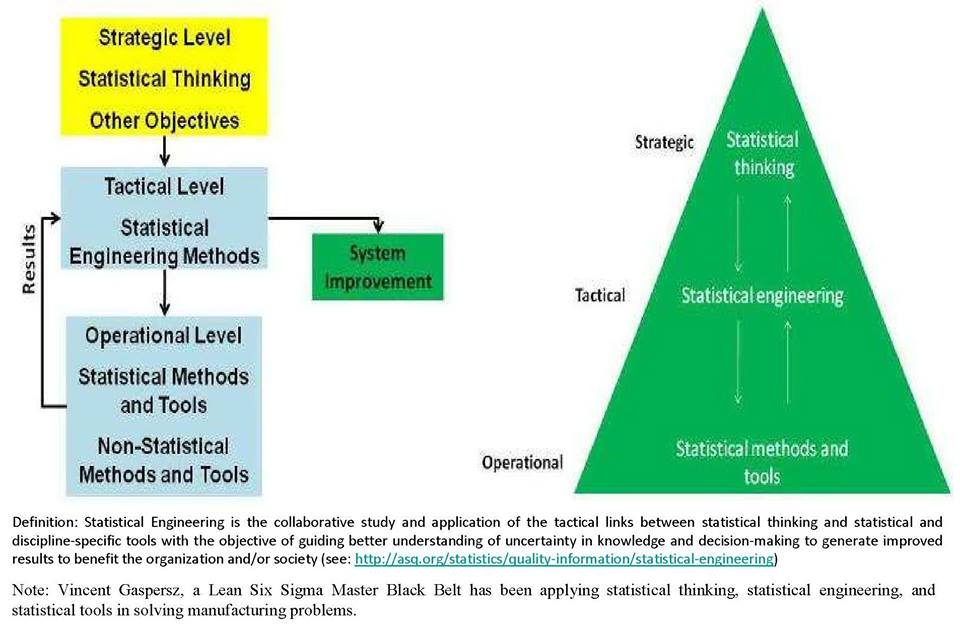
Agar dipahami terlebih dahulu bahwa Statistical Tools biasa diaplikasikan pada level manajemen operasional, Statistical Engineering diaplikasikan pada level manajemen taktikal, dan Statistical Thinking diaplikasikan pada level manajemen strategik pada berbagai level manajemen sistem baik dalam organisasi, negara, skala mikro atau makro, sub-sistem, sistem, maupun super sistem?
Tulisan ini adalah berupa KONSEP yang telah terbukti aplikasinya, sehingga meskipun contoh yang diberikan adalah pada sistem atau subsistem, TETAPI semua konsep dapat diterapkan dalam skala mikro maupun makro, mulai dari subsistem, sistem, sampai super sistem. Bagi mereka yang tidak memahami management systems, maka hampir dapat dipastikan akan mengalami kesulitan dalam memahami aplikasi statistical tools, statistical engineering, dan aplikasi statistical thinking dalam berbagai level manajemen baik pada skala mikro maupun makro, mulai dari level operasional, level taktikal, maupun level strategik. Jadi prasyarat untuk mempelajari statistical tools, statistical engineering, statistical thinking agar efektif dan efisien dalam penggunaannya, maka harus terlebih dahulu memahami management systems.
Saya akan mengambil satu saja alat statistika (statistical tools), yaitu: analisis korelasi untuk dibahas dalam tulisan ini. Analisis korelasi berfungsi untuk mengetahui keeratan hubungan antara dua variabel.
Ketika belajar secara formal dan sangat serius (karena saya berlatar belakang sarjana peternakan yang TIDAK memahami teori-teori statistika, serta pernah tinggal kelas satu tahun karena tidak lulus mata kuliah pengantar statistika yang sangat sederhana di program sarjana peternakan sebelum ada sistem SKS), pada program pascasarjana (S2) Statistika Terapan, saya diajarkan tentang manfaat dari penggunaan analisis korelasi beserta berbagai asumsi yang harus dipenuhinya.
Catatan: Semua statistical tools termasuk analisis univariate maupun multivariate, juga berbagai teknik experimental designs tentu saja menjadi hal yang sangat mudah bagi seorang berpendidikan Master of Applied Statistics (M.St).
Kemudian saya mengetahui bahwa koefisien korelasi akan bervariasi dari minus 1 (hubungan negatif sempurna) sampai plus 1 (hubungan positif sempurna). Semakin tinggi angka koefisien korelasi (apakah positif atau negatif) yang semakin menjauh dari nilai NOL menuju plus/minus SATU, maka kita boleh berharap bahwa terdapat hubungan yang makin erat (apakah positif atau negatif) antara dua variabel yang sedang dipelajari.
Dahulu sebelum ada paket software komputer, maka saya selalu menggunakan kalkulator biasa, harus membuat kolom-kolom dalam kertas putih menggunakan penggaris dan mulai melakukan perhitungan-perhitungan: tentang jumlah pasangan data (n), nilai total variabel X (Total X), nilai total variabel Y (Total Y), nilai total X-kuadrat, nilai total Y-kuadrat, dan nilai total XY (perkalian angka X dengan angka Y). Selanjutnya nilai-nilai total itu dimasukkan ke dalam rumus korelasi untuk menghitung koefisien korelasi. Kemudian menguji signifikansi menggunakan tabel t-Student, dan menarik kesimpulan: terdapat hubungan positif yang sangat signifikan (jika p < 0,01) antara variabel X dan variabel Y, apabila koefisien korelasi positif besar mendekati satu.
Selanjutnya dengan kemajuan teknologi software komputer, maka perhitungan analisis korelasi yang melelahkan secara manual dan membutuhkan waktu lama dengan tingkat ketelitian tinggi TELAH dapat dilakukan secara singkat (dalam hitungan detik) dengan tingkat akurasi mencapai 100%.
Meskipun program pascasarjana (S2) Statistika Terapan TELAH memberikan landasan yang sangat kuat tentang ilmu statistika, TETAPI penerapannya bagi saya pribadi masih “meraba-raba” terutama memilih variabel-variabel apa saja yang perlu dipelajari dalam penggunaan statistical tools itu. Kita akan menjadi ahli penggunaan statistical tools, TETAPI saya merasa ada yang kurang dalam aplikasi pada dunia nyata (pengalaman pribadi belajar Statistical Tools).
Ketika mengikuti program Doktor (S3) Teknik Sistem dan Manajemen Industri saya berkenalan dengan Statistical Engineering yang lebih mudah untuk diaplikasikan dalam dunia nyata. Ketika kuliah pada program S3 Teknik Sistem dan Manajemen Industri itu, berbagai pendekatan sistem baik secara teori sistem, pemodelan sistem, analisis sistem, perbaikan sistem, sampai pada desain sistem baru maupun desain ulang sistem, baik pada skala mikro (organisasi) maupun pada skala makro (negara) dipelajari secara intensif.
Melalui Statistical Engineering, maka penggunaan analisis korelasi, misalnya dalam kasus yang mau disampaikan ini, menjadi semakin nyata dan mudah dalam memahaminya. Ikuti pembahasan tentang Statistical Engineering.
Sistem didefinisikan sebagai kumpulan elemen/komponen yang saling berinteraksi satu sama lain dalam mekanisme hubungan paralel dan/atau serial untuk mencapai suatu tujuan tertentu.
Jika kita memahami fungsi matematik: O (output) akan tergantung pada I (input), maka kita bisa melakukan analisis korelasi antara variabel input (I) dan variabel output (O) pada sistem apa saja, baik mikro maupun makro. Dalam hal ini pemahaman kita terhadap analisis korelasi, misalnya, bukan sekedar menghitung koefisien korelasi dan mencari tahu keeratan hubungan antara variabel X dan variabel Y, TETAPI kita mampu memetakan perilaku sistem melalui hubungan antara variabel Input (I) yang diproses (P) untuk menghasilkan variabel Output (O) yang diinginkan.
Hal ini bisa diterangkan misalnya dalam manajemen produksi dikenal apa yang disebut BOM (Bill of Materials), Formula, Resep, dll.
Saya mengambil contoh untuk merakit satu buah mobil (Output = 1 unit), kita membutuhkan lima buah ban (Input = 5 unit), maka secara otomatis apabila kita akan merakit 10,000 mobil (Output = 10,000 unit), maka kita membutuhkan bahan baku ban sebanyak 10,000 unit mobil x 5 ban/unit mobil = 50,000 buah ban.
Analisis korelasi terhadap penggunaan ban (Input) dalam proses produksi untuk menghasilkan mobil (Output) dapat dihitung dan ditelusuri tingkat efisiensi dan produktivitas HANYA berdasarkan besaran koefisien korelasi antara Input ban dan Output mobil. Dalam hal ini pemahaman Statistical Engineering TELAH menjadi lebih bermanfaat daripada sekedar pemahaman Statistical Tools.
Terlihat perbedaan, apabila kita HANYA memahami Statistical Tools (dalam contoh analisis korelasi), maka kita hanya MAMPU menganalisis koefisien korelasi dan informasi yang diperoleh HANYA keeratan hubungan antara dua variabel X dan Y. TETAPI apabila kita telah memahami Statistical Engineering, maka kita akan MAMPU memilih variabel yang relevan dalam sistem, melakukan analisis perilaku sistem, menghitung efisiensi dan produktivitas sistem, dan berbagai informasi lainnya, dan semua itu HANYA berdasarkan besaran koefisien korelasi. Jadi bukan sekedar mengetahui keeratan hubungan antara dua variabel, TETAPI jauh melampaui hal itu.
Bagaimanapun, saya masih merasa belum PUAS dalam memahami Statistical Tools yang telah dipelajari pada program pascasarjana (S2) Statistika Terapan, maupun Statistical Engineering yang diperoleh pada program Doktor (S3) Teknik Sistem dan Manajemen Industri.
Karena kuliah S4 tidak ada lagi (yang ada es teller), maka saya mencari terus tentang pengembangan Statistical Tools maupun Statistical Engineering yang telah dipahami itu. Pencarian terus-menerus ini membuahkan hasil ketika belajar dan mengambil ujian sertifikasi dalam bidang Six Sigma, mulai dari belajar tentang Six Sigma, mengikuti ujian level Six Sigma Black Belt, sampai Six Sigma Master Black Belt (tingkatan paling tinggi dalam kurikulum Six Sigma). Pemahaman itu ditemukan melalui Statistical Thinking yang akan diuraikan berikut ini.
Jika maksimum dari koefisien korelasi positif adalah plus satu (+1) dan minimum dari koefisien korelasi negatif adalah minus satu (-1), maka analisis pemborosan (waste) dalam sistem dapat menggunakan koefisien korelasi dalam rentang nilai minus 1 sampai plus 1 itu.
Kembali kepada contoh penggunaan Input ban (I) yang diproses dalam sistem produksi (P) untuk menghasilkan Output mobil (O). Jika diketahui bahwa hubungan kedua variabel Input (I) dengan Output (O) dapat menggunakan analisis korelasi, maka secara otomatis apabila besaran koefisien korelasi adalah Plus 1 (+1), maka sistem produksi mobil sangat sempurna dalam arti terjadi Zero Defect. Artinya, jika kita MAMPU mempertahankan kinerja dari sistem produksi mobil tetap sempurna, yaitu: setiap mobil (O = 1 mobil) HANYA menggunakan ban (I = 5 buah), sesuai standar produksi TANPA cacat (orientasi Lean Six Sigma), maka semua data variabel penggunaan ban (Input) apabila dikorelasikan dengan semua data variabel hasil mobil (Output) HARUS bernilai Plus 1 (+1).
Penyimpangan dari nilai koefisien korelasi PLUS 1 (+1) berarti TELAH terjadi pemborosan penggunaan sumber daya Input dalam contoh ini adalah ban. Tentu saja kita bisa memberikan toleransi sampai berapa persen BOLEH diijinkan pemborosan, jika berbagai input lainnya seperti: mesin-mesin, tenaga kerja, fasilitas, dll belum sempurna untuk mendukung Konsep Produksi Lean Six Sigma (Zero Defect and Zero Waste Oriented).
Bagaimanapun apabila koefisien korelasi telah jauh menyimpang dari PLUS 1 (+1), katakanlah menjadi PLUS 0,7 (+0,7), maka kita BUKAN saja HARUS memperbaiki SISTEM, TETAPI harus mencurigai bahwa kemungkinan besar ada tindakan kriminal pencurian ban-ban mobil dalam pabrik.
Tampak betapa sangat penting dan sangat berharga dalam meningkatkan kinerja sistem, ketika kita memahami aplikasi Statistical Thinking dalam Manajemen Sistem.
Terlihat bahwa suatu analisis korelasi sederhana pada seseorang yang HANYA memahami Statistical Tools semata, maka ia HANYA akan menghasilkan informasi tentang keeratan hubungan antara dua variabel.
Ketika analisis korelasi sederhana itu dilakukan oleh seseorang yang memahami Statistical Engineering, maka ia akan mampu mengendalikan perilaku sistem melalui pengendalian kualitas, efisiensi, produktivitas, dll.
TETAPI ketika analisis korelasi sederhana itu dilakukan oleh seseorang yang memahami Statistical Thinking, maka ia akan MAMPU memutuskan apakah perlu meningkatkan kinerja Sistem menggunakan Pendekatan Six Sigma, DMAIC, yaitu: DEFINE variabel-variabel yang akan dipelajari, MEASURE data dari variabel-variabel dalam sistem, ANALYZE menggunakan statistical tools (dalam contoh adalah korelasi sederhana), IMPROVE meningkatkan kinerja sistem agar mendekati atau mencapai zero defect (koefisien korelasi sama dengan plus 1 untuk Input ban dan Output mobil), dan CONTROL mengendalikan sistem agar tetap sempurna menghasilkan zero defect (dalam contoh ini koefisien korelasi tetap PLUS 1).
Jika pendekatan DMAIC tidak akan mampu membawa sistem menuju zero defect (koefisien korelasi PLUS 1 dalam contoh Input ban dan Output mobil), maka seseorang yang memahami Statistical Thinking HARUS mendesain ulang sistem menggunakan pendekatan Design for Lean Six Sigma (DMADV = Define, Measure, Analyze, Design, Verify).
Dalam dunia nyata, kedua pendekatan ini Lean Six Sigma DMAIC (Define, Measure, Analyze, Improve, Control) dan Design for Lean Six Sigma DMADV (Define, Measure, Analyze, Design, Verify) ini dipergunakan atau diterapkan tergantung pada situasi dan kondisi sistem real yang ada.
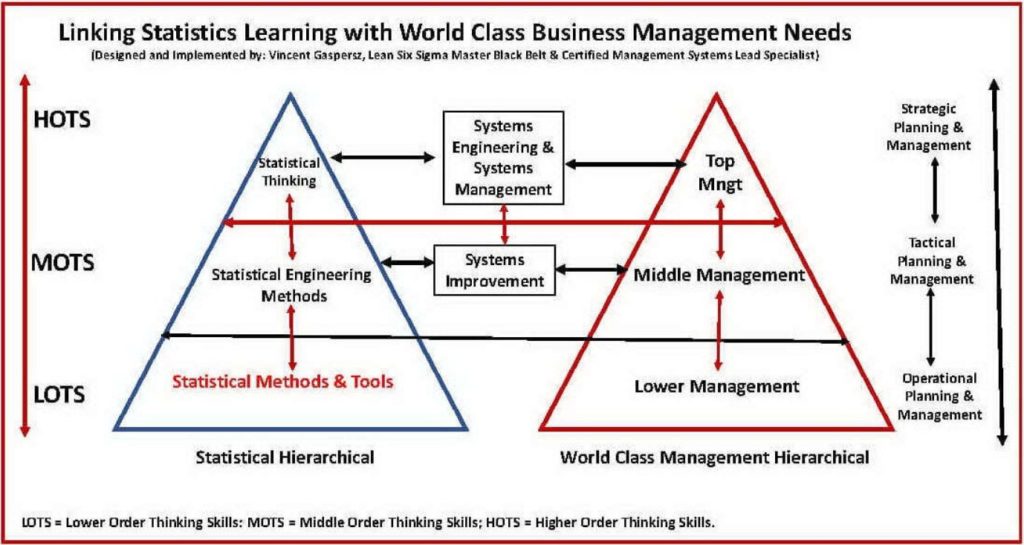
Berdasarkan kurikulum Lean Six Sigma, maka seorang Green Belt harus menguasai Statistical Tools dan akan ditempatkan pada level operasional untuk bekerjasama dengan supervisors. Seorang Black Belt harus menguasai Statistical Tools dan Statistical Engineering dan bekerja sama dengan para managers (middle management). Sedangkan seorang Master Black Belt harus menguasai Statistical Tools, Statistical Engineering, dan Statistical Thinking agar mampu bekerja sama dengan top management (CEO, COO, Directors, etc).
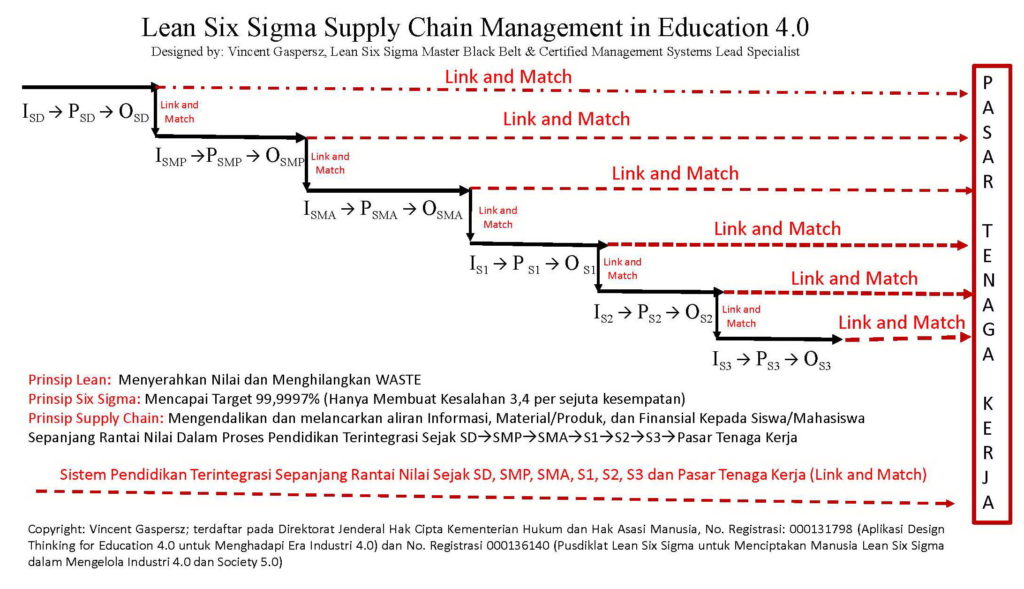
Jika kita telah memahami hal di atas, pertanyaan saya mengapa kurikulum Statistika di perguruan tinggi Indonesia tidak mau mengadopsi atau menyesuaikan dengan kurikulum Lean Six Sigma agar lulusan perguruan tinggi di Indonesia MAMPU berkompetisi dalam pasar global? Alasan paling mungkin adalah kualitas dosen yang “lack of experience” dalam aplikasi statistical tools, statistical engineering, dan statistical thinking dalam berbagai situasi dan kondisi nyata untuk meningkatkan kinerja sistem-sistem yang ada.
Itu yang saya harapkan agar jurusan teknik, terutama teknik industri menambah keterampilan berpikir statistika (statistical thinking), karena mereka telah memahami statistical engineering and statistical tools. TETAPI bagi jurusan lain, termasuk jurusan statistika sendiri yang telah memahami statistical tools BELUM tentu memahami statistical engineering dan statistical thinking.
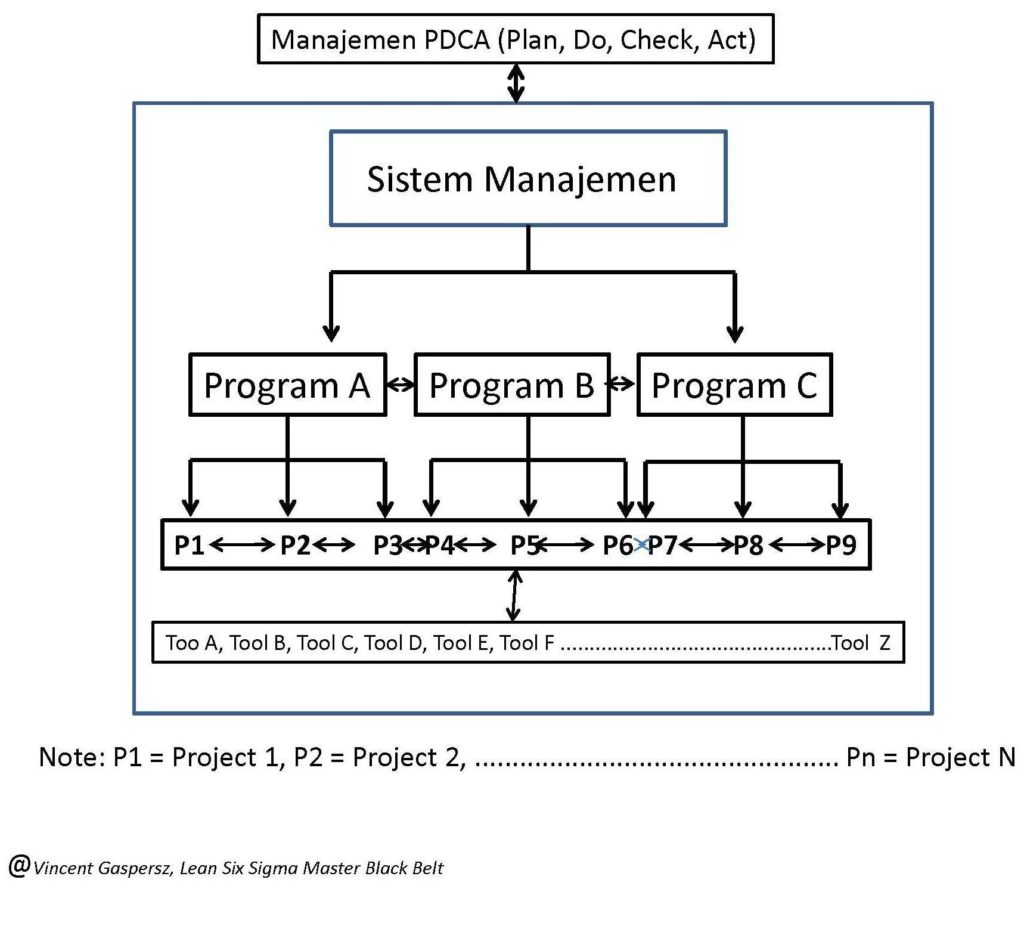
Kelemahan sekaligus kesalahan terbesar ketika belajar statistika di perguruan tinggi adalah para dosen dan mahasiswa belajar dengan mindset bahwa statistika HANYA terdiri dari kumpulan rumus-rumus dan uji-uji statistika sehingga seolah-olah statistika HANYA melatih keterampilan berhitung saja. Padahal belajar matematika dan statistika sesungguhnya adalah untuk meningkatkan keterampilan berpikir logika dan tajam dalam menganalisis suatu permasalahan dalam sistem-sistem apa saja, kemudian memecahkan masalah-masalah sistem itu agar meningkatkan kinerja dari sistem seperti bagan yang ditunjukkan dalam tulisan di atas.
Hal di atas dapat terjadi karena buku-buku statistika yang dipublikasikan, baik dalam bahasa Indonesia maupun dalam bahasa Inggris HANYA membahas statistical tools, dan jarang mengaitkan antara statistical tools, statistical engineering, and statistical thinking. Contoh buku teks berikut yang menampilkan 100 uji-uji statistika disajikan seperti buku resep yang mudah. TETAPI bagi mereka yang belajar statistika dari buku semacam ini HANYA memahami statistical tools saja. HAMPIR dipastikan tidak akan memahami statistical engineering, apalagi statistical thinking.
http://gen.lib.rus.ec/book/index.php?md5=756173AEB88205E5B55FBAB74F2F85A4
Mulai dari mana saya Belajar Statistical Tools, Statistical Thinking, and Statistical Engineering? Jawaban saya adalah: download buku Systems Thinking: Creative Holism for Managers berikut, kemudian baca sampai tamat buku ini, baru mulai memikirkan belajar Statistika, Operations Research atau Management Science, dan berbagai ilmu lainnya. TANPA memahami terlebih dahulu tentang Systems Thinking ini, maka apapun yang akan Anda pelajari akan sia-sia. Itu pengalaman pribadi saya. Jika ada hal-hal yang tidak dipahami dalam buku Systems Thinking ini, maka boleh menanyakan kepada saya, baik langsung via facebook maupun via inbox facebook.
http://gen.lib.rus.ec/book/index.php?md5=1784046B923CBB7063567D2B157A5326
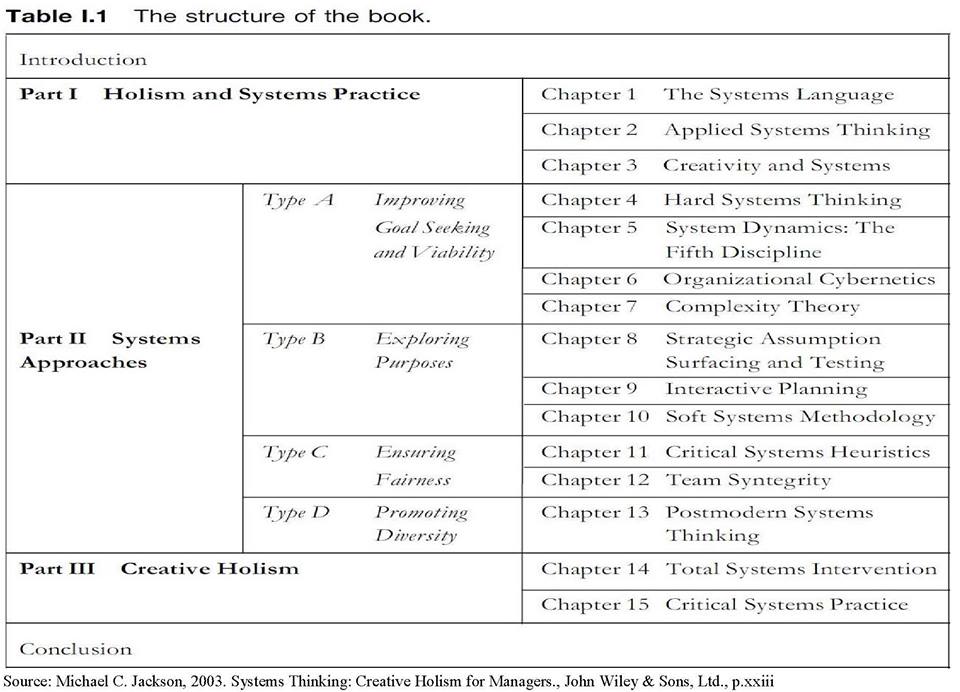
Setelah memahami seluk-beluk tentang SISTEM dalam buku Systems Thinking yang direkomendasikan di atas, maka berbagai ilmu manajemen menjadi SANGAT MUDAH dipahami!! Karena Manajemen Modern yang dibahas sekarang ini berlandaskan pada tiga aliran utama, yaitu: (1) Systems Approach, (2) Management Science Approach, dan (3) Contingency or Situational Approach. Bagan terlampir adalah struktur dari buku Systems Thinking yang direkomendasikan untuk mulai belajar dari sana. Mengapa semua lulusan S1/S2/S3 dari ITB sangat memahami Systems Thinking? Karena Systems Thinking adalah mata pelajaran wajib yang diberikan kepada seluruh mahasiswa ITB, apakah berbentuk mata kuliah khusus atau kuliah pengantar dari hampir semua mata kuliah yang diberikan. Tentu saja karena dosen-dosen ITB juga telah memahami (berkompeten) tentang Systems Thinking.
Salam SUCCESS.
How to Apply Statistical Tools, Statistical Engineering, and Statistical Thinking? Explanation Based on Actual Experience
By: Vincent Gaspersz, Lean Six Sigma Master Black Belt,
The American Society for Quality (www.asq.org) Certified Manager of Quality/Organizational Excellence (CMQ/OE), Certified Quality Engineer (CQE), Certified Six Sigma Black Belt (CSSBB), Certified Quality Auditor (CQA),
The American Production and Inventory Control Society (www.apics.org) Certified Fellow in Production and Inventory Management (CFPIM), Certified Supply Chain Professional (CSCP),
The International Quality Federation (www.iqf.org) Six Sigma Master Black Belt (SSMBB),
The Registrar Accreditation Board (RAB) by Australia-based Quality Society of Australia (QSA)- (www.exemplarglobal.org) Certified Management Systems Practitioneer (CMSP)
Many questions arose in my Facebook inbox about what was meant by those Statistical Tools, Statistical Tools, Statistical Engineering, and Statistical Thinking as well as how to apply each of them?
Firstly, to be understood that Statistical Tools are usually applied at operational management level, Statistical Engineering is applied at tactical management level, and Statistical Thinking is applied at strategic management level on various systems management level whether in organization, country, micro- or macro-scale, sub-system, system, or super system.
This writing is a CONCEPT that has been proven on its application, so that although the example given is on system or sub-system; BUT all concepts can be applied at the micro- or macro-scale, beginning from sub-system, system, to super system. For those who do not understand systems management, then they would almost certainly be ascertained to have difficulty in understanding the applications of statistical tools, statistical engineering, and statistical thinking at various management levels, whether at the micro- or macro-scale, beginning from the operational level, tactical level, or strategic level. Therefore, the prerequisite to learn statistical tools, statistical engineering, statistical thinking and to apply their uses effectively and efficiently, then you must first understand systems management.
I will take just one statistical tool, which is: correlation analysist to be discussed in this writing. Correlation analysis functions to find out the closeness of relationship between two variables.
When studying formally and very seriously (because I had a bachelor of livestock science background who DID NOT understand statistical theories, as well as had stayed behind for a year because I did not pass the very simple introduction of statistics course in the livestock science program before there had been academic credits system), in Master’s of Applied Statistics program, I was taught about the benefits of using correlation analysis and the various assumptions that ought to be fulfilled.
Note: All statistical tools, including univariate or multivariate analysis, and various experimental designs techniques should surely be something that is very easy for someone who has Master’s of Applied Statistics (M.St).
Then I understood that correlation coefficient would vary from minus 1 (perfect negative relationship) to plus 1 (perfect positive relationship). The higher the correlation coefficient value (whether positive or negative), the further away from 0 value towards plus/minus 1, then we can hope that there’s even closer relationship (whether positive or negative) between the two variables being studied.
Back then, before there were computer software package, I always used a regular calculator, had to create columns on a white paper using a ruler and began to do calculations about: the number of pairs of data (n), total value of variable X (Total X), total value of variable Y (Total Y), total value of X-squared, total value of Y-squared, and total value of XY (multiplication of X and Y). Next, those total values were entered into correlation formula to calculate correlation coefficient. Then, I had to test for significance using t-Student table, and conclude: there is a very significant positive relationship (if p < 0.01) between variable X and variable Y, if the large positive correlation coefficient is close to 1.
Afterwards, with the computer software technological advancement, then the manually laborious calculation of correlation analysis that took a long time with high level of accuracy, HAD been able to be done instantly (in seconds) with the level of accuracy that reached 100%.
Although the Master’s in Applied Statistics program HAD given very strong foundation about statistics, BUT its application for me personally was still “fumbling”, especially in choosing which variables needed to be learnt in the use of those statistical tools. We would become the experts of the use of statistical tools, BUT I feel there was still something lacking in their real-world application (personal experience of learning Statistical Tools).
When taking Doctorate program in Systems Engineering and Industrial Management, I was acquainted with Statistical Engineering which was much easier to be applied in the real-world. When studying in that Doctorate program in Systems Engineering and Industrial Management, various systems approach either as systems theory, systems modeling, systems analysis, systems improvement, up to new systems design or systems redesign, whether at the micro-scale (organization) or at the macro-scale(country were all intensively studied.
Through Statistical Engineering, then the use of correlation analysis, for example in this case that is about to delivered, becomes more obvious and easier to understand. Follow the discussion about Statistical Engineering.
System is defined as a collection of elements/components that interact with each other in parallel and/or serial based mechanism to reach a certain goal.
If we understand the Mathematic function: O (output) will depend on I (Input), then we can do correlation analysis between input variable (I) and output variable (O) on whatever system, whether micro- or macro-. In this case, our understanding of the correlation analysis, for example, is not just to calculate the correlation coefficient and to find out the closeness of relationship between variable X and variable Y, BUT we can map the system behavior through relationship between Input (I) variable that is processed (P) to produce the desired Output (O) variable.
This can be explained, for example, in production management is known what is called BOM (Bill of Materials), Formula, Recipe, etc.
I take the example to assemble one car (Output = 1 unit), we need five tires (Input = 5 unit), then automatically if we would assemble 10,000 cars (Output = 10,000 unit), then we would need raw materials of tires as many as 10,000 units of car x 5 tires/unit of car = 50,000 tires.
Correlation analysis on the use of tires (Input) in the production process to produce cars (Output) can be measured and explored at its level of efficiency and productivity ONLY based on the megnitude of correlation coefficiency between tire Input and car Output. In this case, the understanding of Statistical Engineering HAS become more useful than just the understanding of Statistical Tools.
There are visible differences, if we ONLY understand Statistical Tools (in the correlation analysis example), then we are only ABLE to analyze correlation coefficient and the information obtained is ONLY the closeness of relationship between two variables of X and Y. HOWEVER, if we have understood Statistical Engineering, then we will be ABLE to choose the relevant variables in the system, to do system behavior analysis, calculate system efficiency and productivity, and various other information, and all those are ONLY based on the magnitude of coefficient correlation. Therefore, it is not only to know the closeness of relationship between two variables, BUT it is far beyond that.
However, I was still not yet SATISFIED in understanding Statistical Tools that had been learned in Master’s of Applied Statistics program or Statistical Engineering that had been obtained in Doctorate of Systems Engineering and Industrial Management program.
Because there was no more study after Doctorate, then I continously searched for the development of Statistical Tools or Statistical Engineering that had been understood. This continous search came to fruition when I studied and took certification exam in the field of Six Sigma, beginning from studying about Six Sigma, taking Six Sigma Black Belt level exam, until Six Sigma Master Black Belt (the highest level in Six Sigma curriculum). That understanding is found through Statistical Thinking, which will be explained as follows.
If the maximum of the positive coefficient correlation is plus one (+1) and the minimum of the negative coefficient correlation is minus one (-1), then waste analysis within the system can use correlation coefficient within that range of minus 1 to plus 1.
Back to the example of using the Input of tire (I) that is processed within the production system (P) to generate the Output of car (O). If it is known that the relationship between the two variables of Input (I) and Output (O) can use correlation analysis, then automatically if the magnitude of the correlation coefficient is Plus 1 (+1), then the car production system would be very perfect in the sense, there is Zero Defect. This means, if we CAN maintain the performance of the car production system to remain perfect, which is every car (O = 1 car) ONLY uses tires (I = 5 tires), according to the production standard WITHOUT defect (Lean Six Sigma orientation), then all variable data of the use of tires (Input) if they are correlated with all variable data of the cars result (Output) MUST be Plus 1 (+1).
Deviation from the correlation coefficient of PLUS 1 (+1) means there HAS been wasteful use of Input resources, in this example are tires. Surely we can give tolerance up to how many percentage are waste MAYBE permitted, if other various inputs such as: machineries, labors, facilities, etc. have not been perfect to support Lean Six Sigma Production Concept (Zero Defect and Zero Waste Oriented).
Nevertheless, if coefficient correlation has far deviated from PLUS 1 (+!), say it becomes PLUS 0.7 (+0.7), then we NOT only MUST improve the SYSTEM, BUT we must suspect that most likely there is criminal action of stealing car tires within the factory.
It looks just how very important and very valuable in improving system improvement is when we understand the application of Statistical Thinking in Systems Management.
It looks like that a simple correlation analysis on someone who ONLY understand mere Statistical Tools, then he/she will ONLY produce information about the closeness of relationship between two variables.
But, when that simple correlation analysis is done by someone who understands Statistical Engineering, then he/she will be able to control system behavior through controls of quality, efficiency, productivity, etc.
HOWEVER, when that simple correlation analysis is done by someone who understands Statistical Thinking, then he/she will be ABLE to decide whether it is necessary to improve System performance using Six Sigma Approach, DMAIC, which are to: DEFINE the variables that will be studied, MEASURE data from the variables within the system, ANALYZE using statistical tools (in the example given is simple correlation), IMPROVE system performance to approach or to reach zero defect (correlation coefficient equals to plus 1 for tire Input and car Output), and CONTROL the system to keep it perfect to produce zero defect (in this example, correlation coefficient stays PLUS 1).
If the DMAIC approach will not be able to take the system towards zero defect (correlation coefficient: PLUS 1, in the example of tire Input and car Output), then someone who understands Statistical Thinking MUST redesign the system using the approach of Design for Lean Six Sigma (DMADV = Define, Measure, Analyze, Design, Verify).
In the real world, both of these approaches: Lean Six Sigma DMAIC (Define, Measure, Analyze, Improve, Control) and Design for Lean Six Sigma DMADV (Define, Measure, Analyze, Design, Verify) are used and applied depending on the existing system’s situation and condition.
Based on Lean Six Sigma curriculum, then a Green Belt must master Statistical Tools and will be placed at the operational level to cooperate with supervisors. A Black Belt must master Statistical Tools dan Statistical Engineering and work together with the managers (middle management). Whereas a Master Black Belt must master Statistical Tools, Statistical Engineering, and Statistical Thinking in order to be able to work together with top management (CEO, COO, Directors, etc.).
If we have understood the above, then my question is why does Statistics curricula at Indonesian universities do not want to adopt or adapt to the Lean Six Sigma curriculum so that the university graduates in Indonesia CAN compete in the global market? The most plausible reason may be the quality of lecturers who have “lack of experience” in appying statistical tools, statistical engineering, and statistical thinking in various real situations and conditions to improve the available systems performance.
That is what I hope so that engineering department, especially the industrial engineering to add the statistical thinking skills, because it has understood statistical engineering and statistical tools. BUT for other departments, even including the statistics department that has understood statistical tools has not YET necessarily understood statistical engineering and statistical thinking.
The weakness plus the biggest mistake when learning statistics in higher education are that the lecturers and students study with the mindset that statistics ONLY comprises of collection of formulas and statistical tests so that as if statistics ONLY train mere calculation skills. Besides, studying mathematics and statistics are actually to improve logical thinking skills and sharp analytical skills in facing a problem in whatever systems, then to solve that system’s problems in order to increase the system performance as shown by the chart in the writing above.
The above case can happen because the published statistics books, whether in Indonesian or in English, ONLY examine statistical tools, and rarely connect between statistical tools, statistical engineering, and statistical thinking together. The following textbook example that shows 100 statistical tests is presented like an easy recipe book. BUT for those who learn statistics from this kind of book ONLY to understand just statistical tools, then ALMOST ascertained would not understand statistical engineering, let alone statistical thinking.
http://gen.lib.rus.ec/book/index.php?md5=756173AEB88205E5B55FBAB74F2F85A4
Where do I begin to Learn Statistical Tools, Statistical Thinking, and Statistical Engineering? My answer is: download the following Systems Thinking: Creative Holism for Managers book, start reading until the end, and then start thinking to learn Statistics, Operations Research or Management Science, and various other sciences. WITHOUT understanding first about this Systems Thinking, then whatever you’ll study would be in vain. That is my personal experience. If there are things that you do not understand in this Systems Thinking book, then you can ask me, whether directly via Facebook or indirectly via Facebook inbox.
http://gen.lib.rus.ec/book/index.php?md5=1784046B923CBB7063567D2B157A5326
After understanding the details about SYSTEM in the recommended Systems Thinking book above, then various management sciences would be VERY EASILY understood! Because today’s Modern Management is based on three main schools, which are: (1) Systems Approach, (2) Management Science Approach, and (3) Contingency or Situational Approach. The attached chart below is the structure from the recommended Systems Thinking book and start learning from there. Why do all Bachelor’s/Master’s/Doctorate graduates fully understand Systems Thinking? Because Systems Thinking is the required course given to all ITB students, whether in the form of specialized course or introductory course of almost all available courses. Of course it is because ITB lecturers have also understood (been competent) about Systems Thinking.

Best Regards for SUCCESS.
